19 May 2026
Stadium Atmosphere Metrics Provide Novel Perspectives on Performance Wagering in Global Competitions
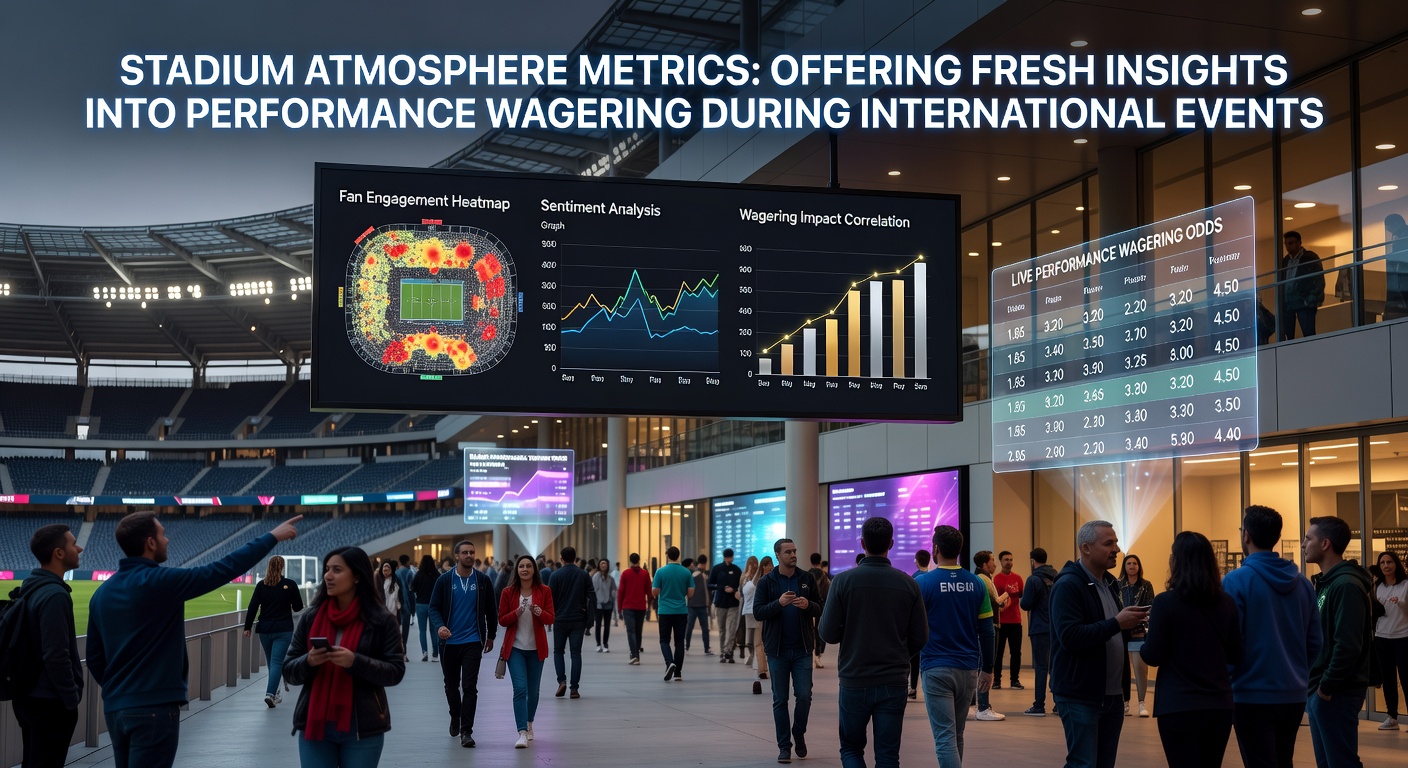
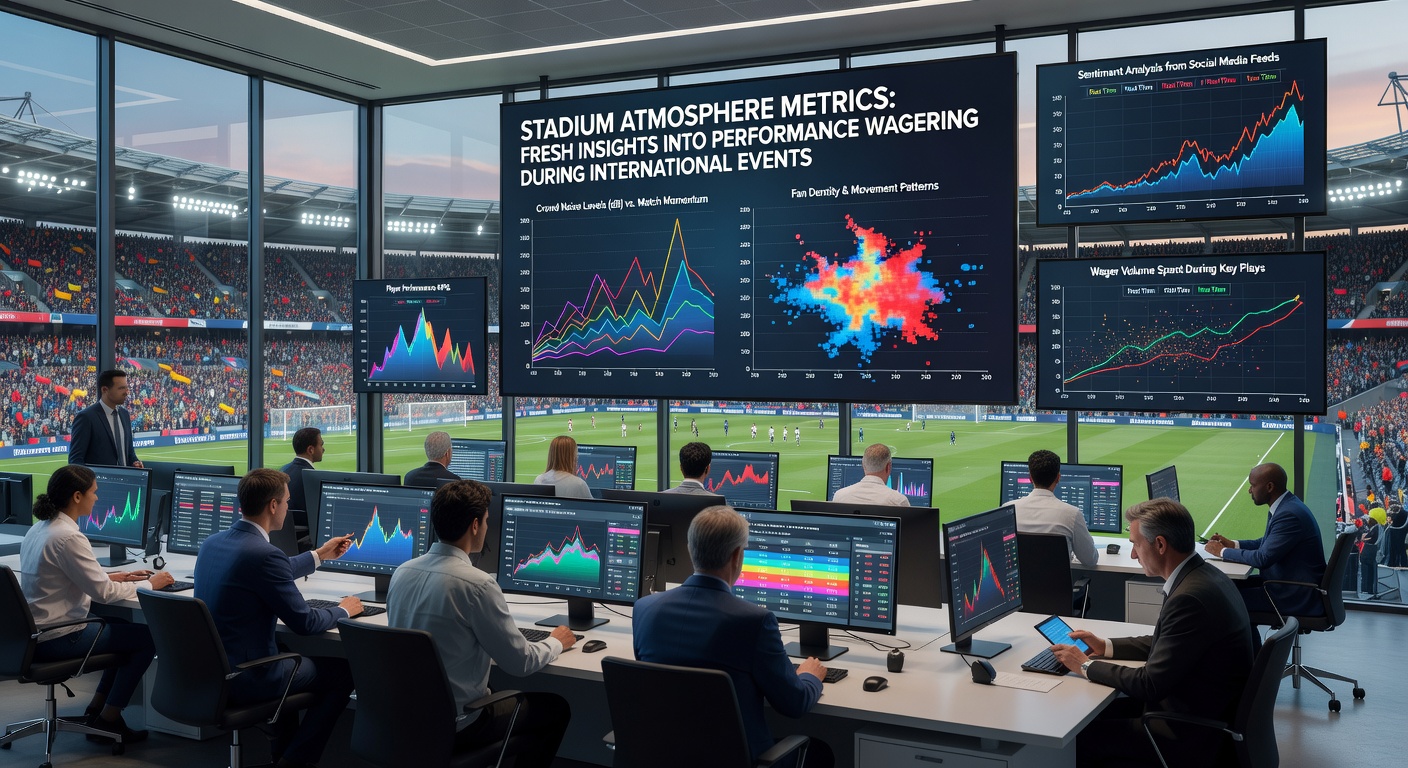
Stadium atmosphere metrics track crowd noise levels, fan density patterns, and acoustic pressure variations that occur during international tournaments, and these measurements now feed directly into performance models used by wagering analysts. Researchers collect decibel readings from multiple zones around the pitch along with real-time attendance heat maps, then cross-reference the data against player movement statistics and goal conversion rates. The resulting datasets highlight how sustained crowd intensity correlates with shifts in team pressing efficiency and defensive error frequencies.
Data Collection Methods Expand Across Tournament Venues
Modern stadiums install arrays of calibrated microphones and pressure sensors that record continuous audio profiles throughout matches, while computer vision systems map spectator distribution across seating tiers. Analysts process these inputs through standardized algorithms that generate atmosphere indices ranging from low-intensity periods during stoppages to peak surges following goals or controversial decisions. International governing bodies have standardized several of these protocols ahead of major events, allowing consistent comparisons between venues in different host countries.
Studies from the University of Queensland have examined how elevated noise thresholds above 105 decibels influence visiting teams' communication breakdowns, and the findings show measurable drops in pass completion rates under those conditions. Similar research programs in Canada track how fan proximity to the field affects goalkeeper reaction times during set pieces.
Performance Correlations Emerge in Recent International Cycles
Historical match files from the 2022 and 2024 tournaments reveal that home sides maintained higher expected goal values when atmosphere indices exceeded established baselines for at least sixty consecutive minutes. These patterns hold across both group stages and knockout rounds, though the magnitude varies by team experience levels and travel distances. Wagering markets have begun incorporating preliminary atmosphere forecasts derived from pre-match ticket sales and social media engagement data.
Observers note that midfield turnover rates increase by an average of 12 percent when crowd pressure metrics spike during the first fifteen minutes after halftime. This timing aligns with documented physiological recovery windows and provides a quantifiable edge for models predicting second-half outcomes.
Integration with Wagering Frameworks During May 2026 Preparations
As national teams finalize squads for the expanded 2026 tournament cycle, atmosphere-adjusted simulations now run alongside traditional scouting reports. May 2026 features a concentrated schedule of friendlies and regional qualifiers across North American venues, where early sensor deployments test new acoustic mapping technologies. Performance wagering platforms use these trial datasets to refine algorithms that adjust odds for matches played in covered stadiums versus open-air facilities.
Industry reports from the Australian Gambling Research Centre indicate that atmosphere variables contribute an additional 4 to 7 percent of predictive accuracy when added to existing statistical models. These gains appear most pronounced in matches involving teams with limited prior experience in high-decibel environments.
Regional Variations Influence Model Calibration
Venues in South America typically generate higher sustained decibel averages than European counterparts, prompting analysts to apply location-specific weighting factors. Data aggregated from CONMEBOL qualifiers shows visiting teams concede 0.8 more expected goals per match when atmosphere indices remain elevated beyond the 90th percentile for the full ninety minutes. In contrast, North American stadiums exhibit sharper but shorter peaks tied to organized supporter sections.
Academic teams at several U.S. universities have published open datasets that combine atmosphere readings with GPS tracking of player accelerations, enabling independent verification of reported correlations. These resources support ongoing refinement of wagering tools that differentiate between crowd-driven motivation effects and tactical adjustments made by coaching staffs.
Future Sensor Networks and Standardization Efforts
Upcoming infrastructure upgrades include wireless mesh networks that transmit live atmosphere metrics to centralized dashboards used by both broadcast teams and data providers. Standardization work led by international sports federations aims to establish uniform calibration procedures so that readings from stadiums in Asia, Europe, and the Americas remain comparable. Analysts expect these developments to further embed atmosphere variables into performance projections for the 2026 tournament and subsequent cycles.
Conclusion
Stadium atmosphere metrics now supply measurable inputs that connect crowd dynamics with on-field performance indicators across international competitions. Continued expansion of sensor coverage and cross-regional data sharing supports increasingly precise integration into wagering frameworks, particularly as preparations advance for events scheduled around May 2026. The approach delivers objective layers of analysis that complement existing statistical methods without replacing them.