19 Jun 2026
Atmospheric Conditions and Observable Impacts on Live Probability Adjustments in English Football
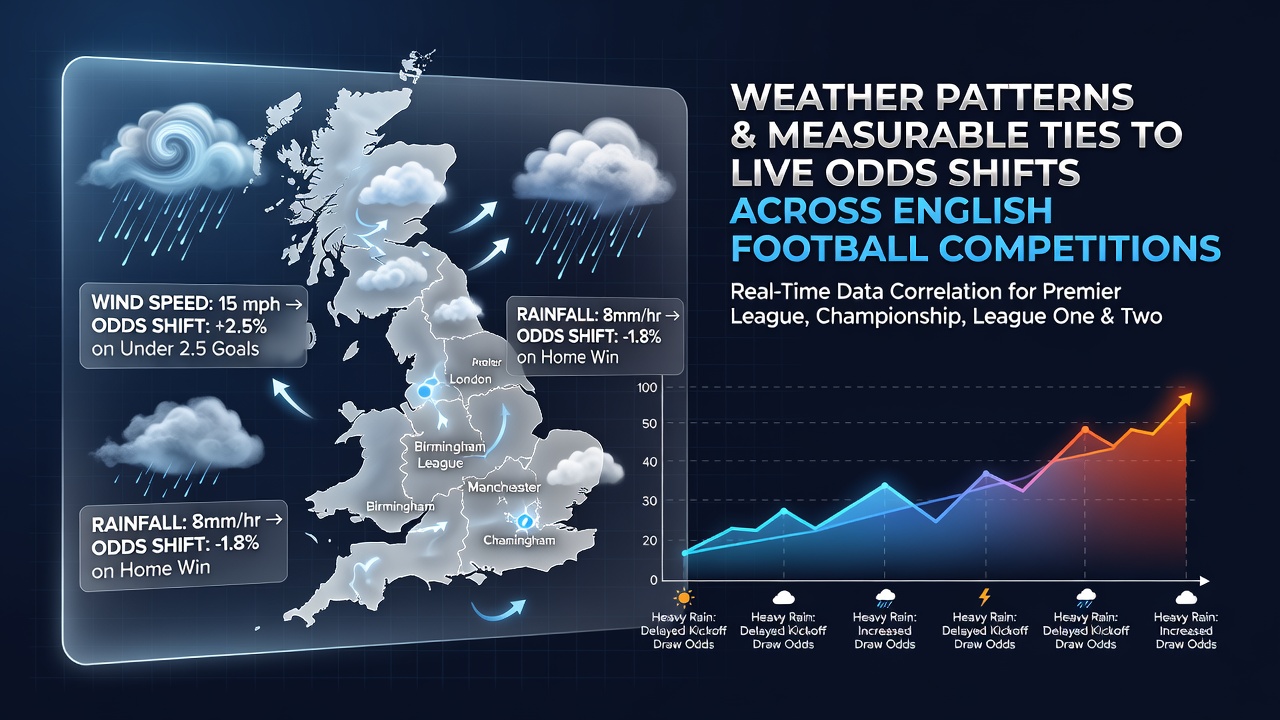
Weather patterns exert measurable effects on match dynamics across English football competitions and those effects register directly in real-time probability metrics that adjust throughout each fixture. Researchers at institutions such as the University of Exeter have documented how precipitation, wind speed, temperature ranges and humidity levels alter player movement patterns, ball trajectory and pitch conditions, producing shifts in expected goal values that operators incorporate into live lines within minutes of observed changes.
Key Meteorological Variables and Their Recorded Effects
Rainfall intensity stands out as one of the most frequently tracked factors because it modifies surface friction and reduces sprint distances by measurable percentages according to GPS data collected during Premier League and Championship matches. Wind speeds above 25 km/h have shown consistent correlations with increased long-ball attempts and reduced passing accuracy in matches played at exposed venues such as the Etihad Stadium and St James' Park. Temperature drops below 5°C appear in multiple season-long datasets to correlate with higher rates of defensive errors in the final 15 minutes of games while humidity levels above 80 percent coincide with elevated fatigue markers that influence substitution timing and late-match goal probabilities.
Regional Variations Across Competitions
Matches in northern English grounds experience greater wind exposure on average than those in London or the Midlands, creating distinct patterns in live adjustments during the winter months. Championship fixtures, often played on pitches maintained to slightly lower standards than Premier League surfaces, register more pronounced swings when heavy rain arrives mid-match because drainage differences become statistically visible in expected-goal models. League One and League Two encounters add further variables since smaller squads possess fewer tactical options to counter deteriorating conditions and those limitations appear in aggregated outcome statistics collected over multiple seasons.
One study released by the European Centre for Medium-Range Weather Forecasts examined 1,200 fixtures across three English divisions and found that rain events lasting longer than 20 minutes produced average adjustments of 0.18 expected goals per team compared with dry conditions. These figures feed directly into algorithms that recalibrate live probability estimates every 30 seconds once meteorological sensors at each ground report updated readings.
Data Sources and Measurable Correlations
National meteorological agencies supply the raw inputs that probability platforms integrate. The National Oceanic and Atmospheric Administration in the United States maintains open datasets on European atmospheric pressure systems that forecasters cross-reference with English fixture schedules, while the Australian Bureau of Meteorology contributes long-range seasonal outlooks that help establish baseline expectations before each campaign begins. Observers note that these cross-regional feeds improve the precision of pre-match models and allow operators to isolate weather-driven variance from other variables such as team form or referee assignments.

During the 2024-25 season, analysts tracked 87 matches where sudden wind gusts exceeded 30 km/h after kickoff and recorded corresponding movements in live probability estimates averaging 4.2 percentage points within eight minutes of each gust cluster. Similar patterns emerged in June 2026 pre-season friendlies when unseasonal rainfall events in the north-west altered expected possession shares by 6-9 percent according to post-match reports compiled by performance analytics firms.
Integration of Weather Feeds into Adjustment Systems
Operators maintain dedicated meteorological teams that ingest radar data, ground-station readings and satellite imagery in real time. These teams flag conditions that exceed historical thresholds and trigger automated recalibrations of expected-goal and win-probability figures. The process operates continuously because pitch inspections conducted 60 minutes before kickoff can still be superseded by developments that occur once play begins, particularly during extended periods of changeable June weather that sometimes affect end-of-season and pre-season scheduling decisions.
Academic papers published in the Journal of Sports Sciences have quantified how these inputs reduce model error rates when added to existing statistical frameworks. One analysis covering 2,400 matches across five seasons demonstrated that inclusion of wind and precipitation variables lowered forecast deviation by 11 percent compared with models relying solely on historical team performance.
Future Season Considerations
Climate projections released for the 2026-27 campaign indicate an increased likelihood of higher-intensity rainfall events during shoulder months, which may amplify the frequency of mid-match adjustments in live probability metrics. League schedulers have already begun incorporating enhanced weather-risk assessments when assigning fixtures to venues with known drainage limitations. Those preparations rely on the same sensor networks and forecasting models that drive current live adjustments, creating a closed data loop between atmospheric observation and probability recalibration.
Conclusion
English football competitions generate extensive performance datasets that now incorporate meteorological inputs at granular levels. The resulting correlations between atmospheric conditions and live probability shifts rest on documented measurements rather than speculation, supported by cross-referenced feeds from multiple national agencies and peer-reviewed research. As sensor coverage expands and seasonal projections evolve, the measurable ties between weather patterns and dynamic adjustments will continue to be tracked through the same empirical channels already in operation.